How Inclusive is the Outdoors?
Infographic Poster
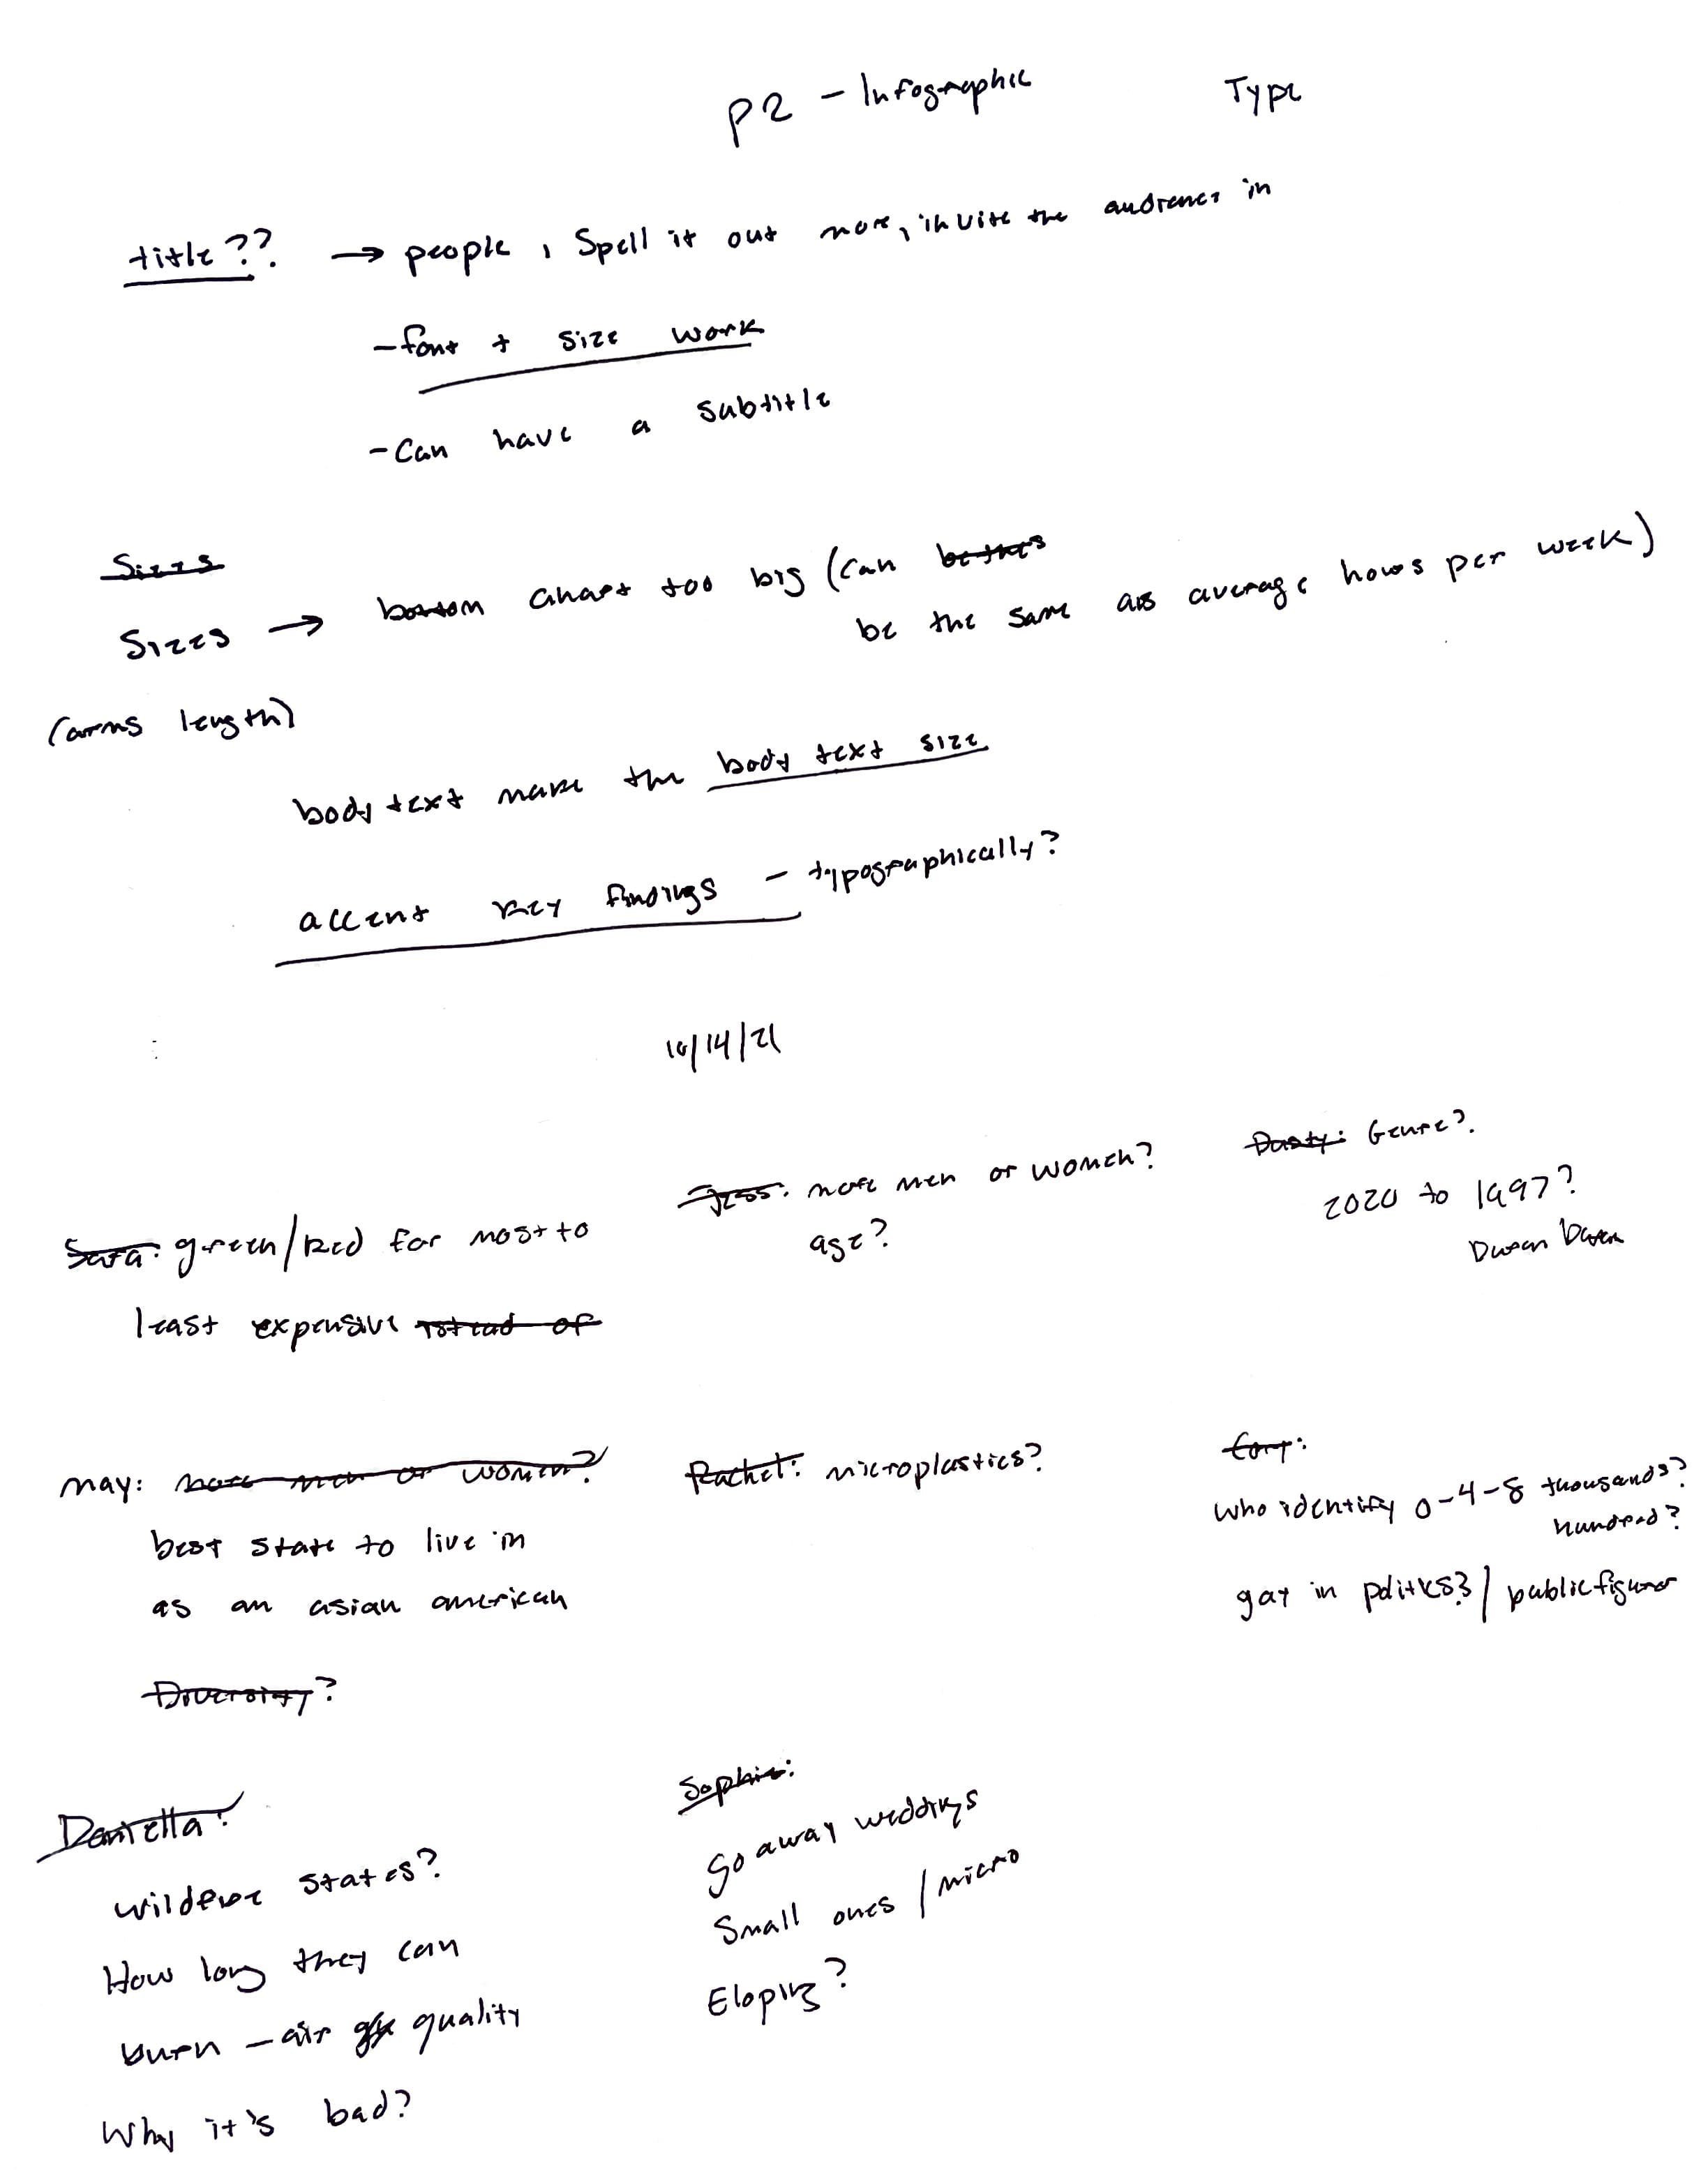
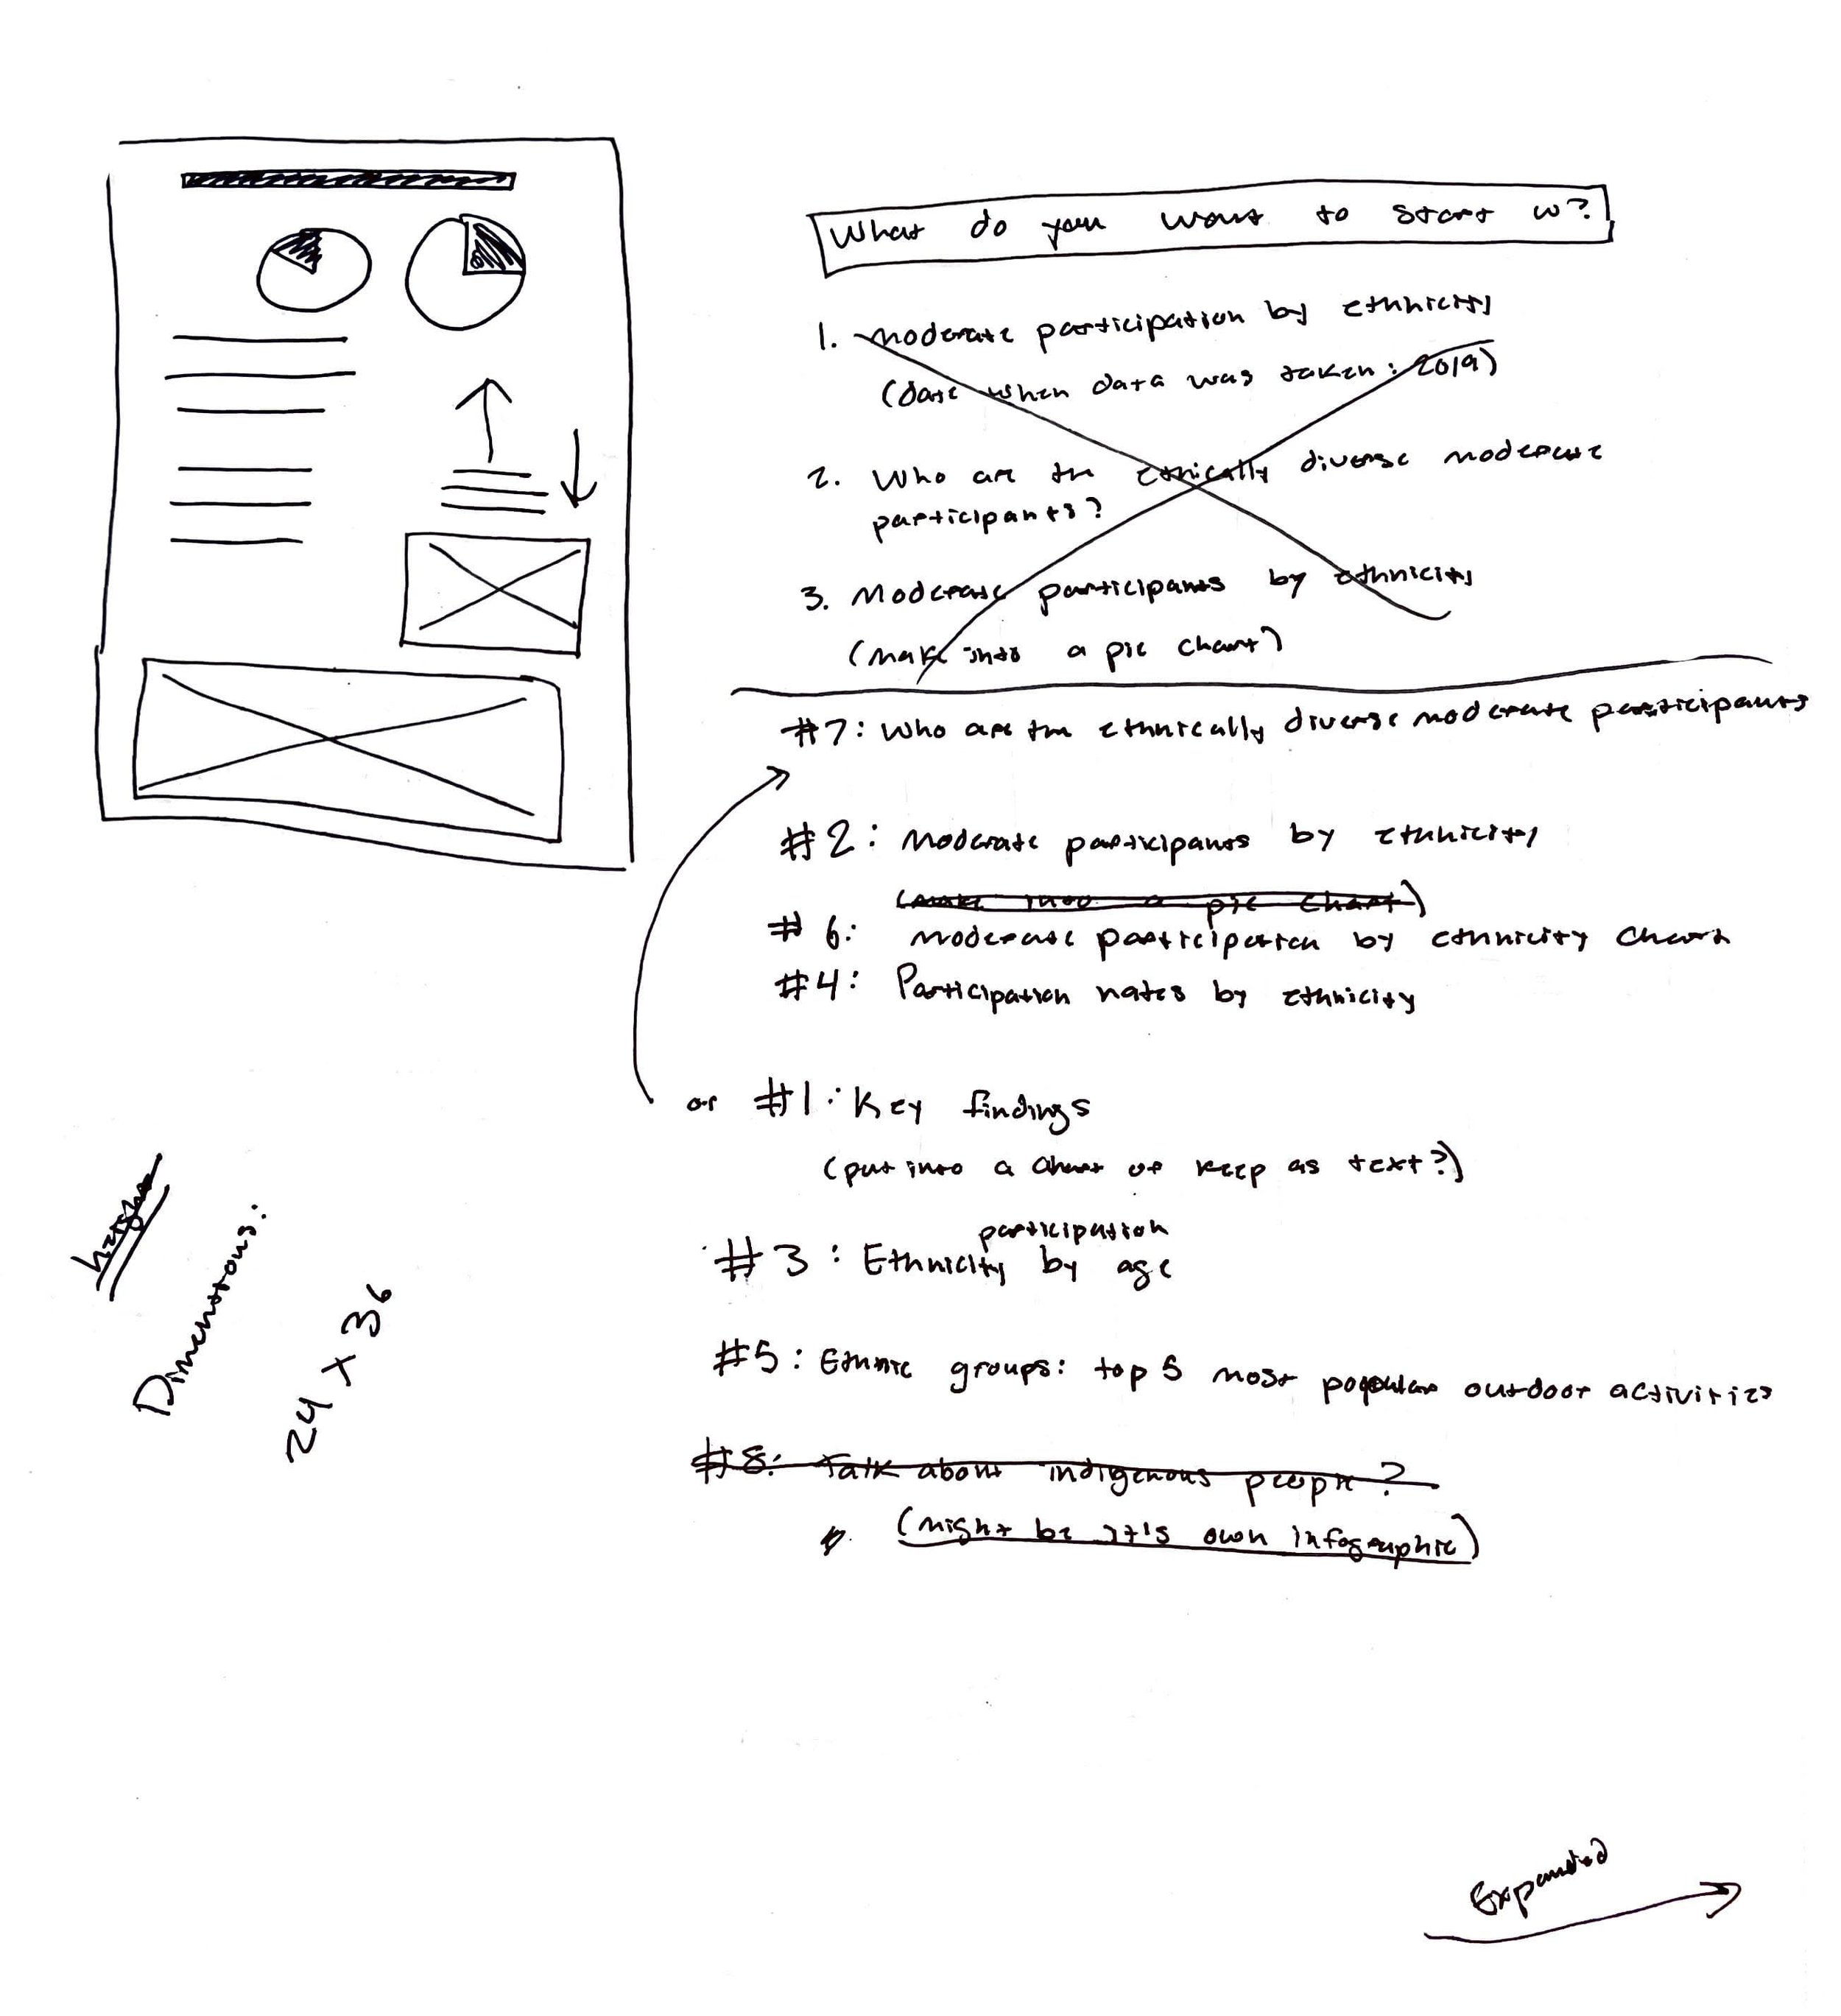
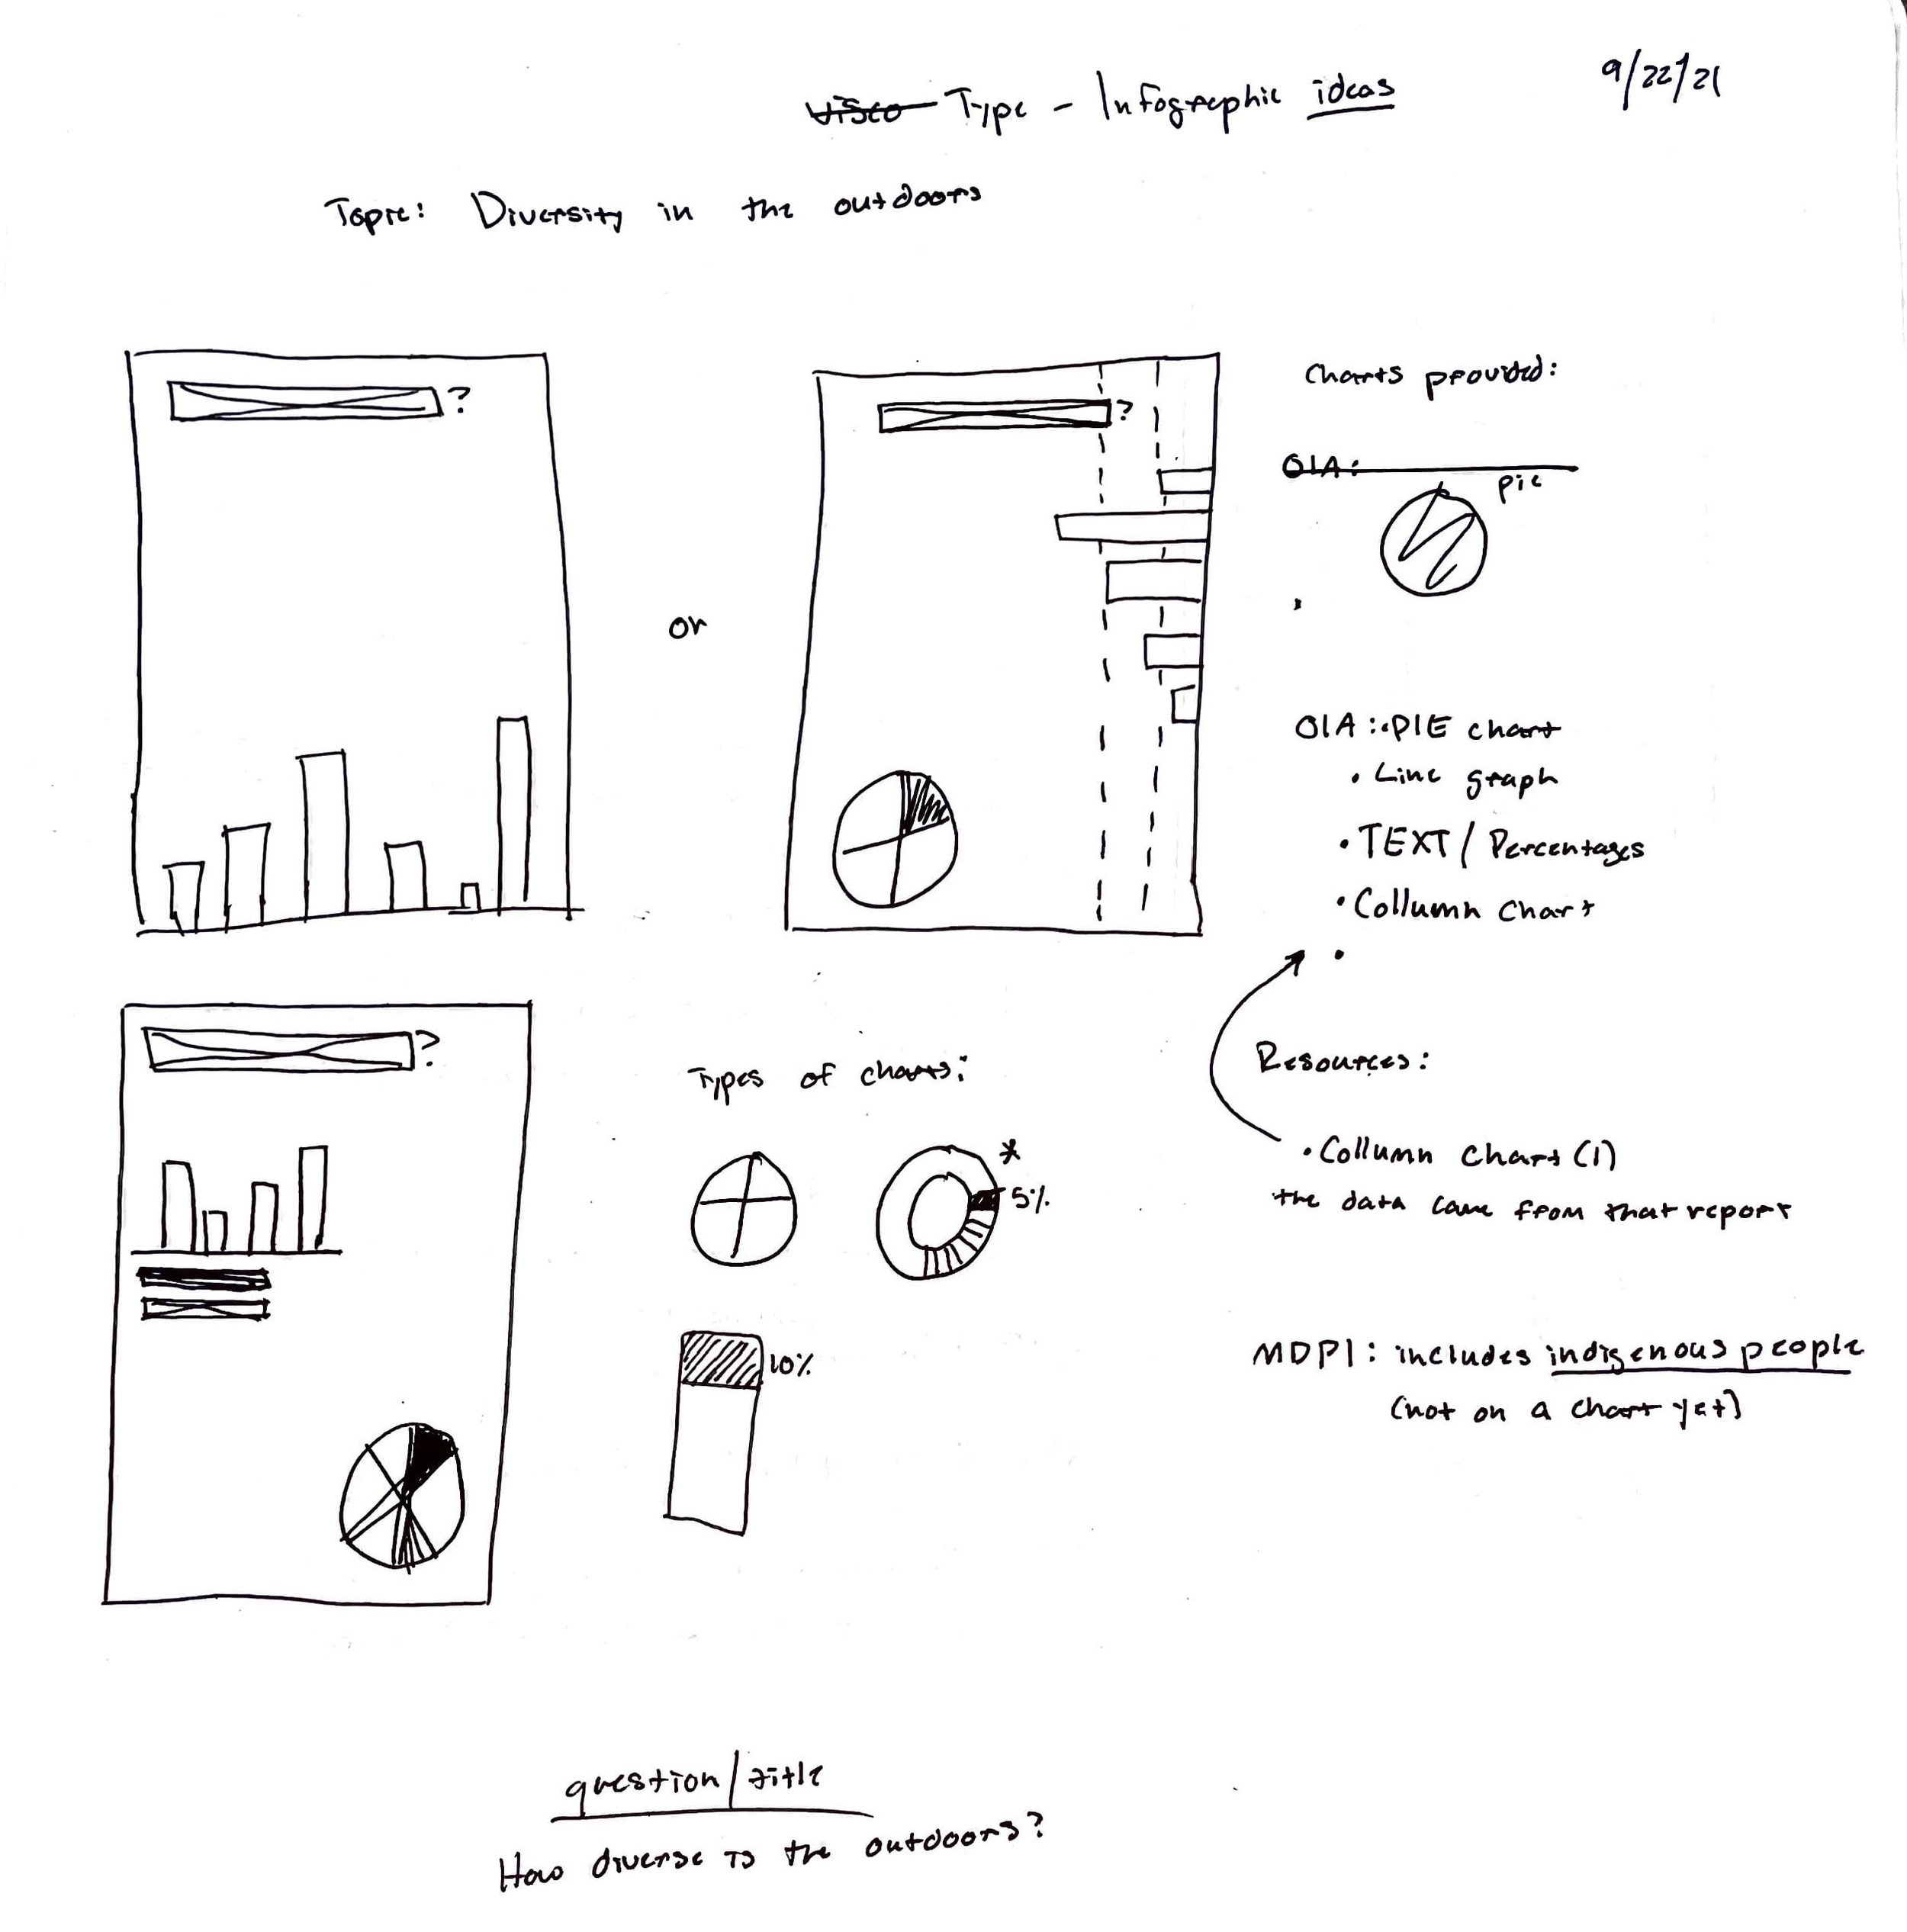
In this project, we were tasked with selecting a data-driven topic and conducting research to gather relevant data. With the information and data gathered we had to create poster sketches in order to choose the best style of graph or chart. We had to make sure our conclusions or findings were clear to the audience and had to think about what we were trying to say with the data and offer everything to support that statement. As the final poster was quite large, we had to make sure that all the information was easily legible, while still being visually engaging.
Deliverables:
Poster


